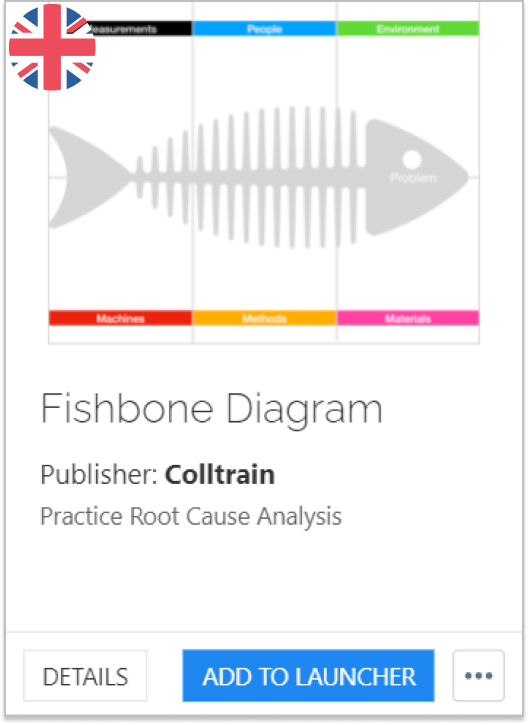
Fishbone Diagram
Experiment with root cause analysis as part of problem-solving sessions
Description
Participants brainstorm about the possible causes of a symptomatic problem. They consider a current problem they face within their team/organization. The Fishbone diagram enables participants to focus on the causes rather than on the symptoms of the problem. This way, they can solve and prevent further similar problems.
Flow
Introduction
- The facilitator introduces the activity – the Colltrain Board, the MyBoard option, the scope and stages of the activity.
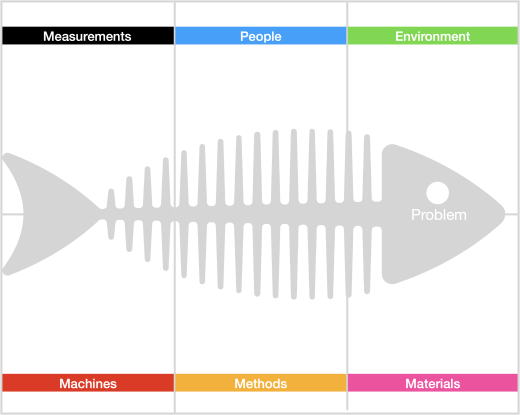
- The facilitator writes down on a sticky note the problem they will consider during the next stages of the activity.
- Then they place this sticky note over the fish’s head.
Work
- The activity starts with silent brainstorming. Participants use MyBoard to write down 3 possible causes (one cause/sticky note).
- Then they present in plenary their list of causes. One by one, participants take the sticky notes from MyBoard and place them on the fishbone board. They place them under the most suitable category. There are 6 categories: measurements, people, environment, machines, methods, and materials.
- While presenting, ask participants “Why did that happen?” and generate deeper levels of causes. Layers of branches display causal relationships.
- In the next stage, participants deduplicate the series of causes.
- Then they dot vote on the cause they consider to be the root cause of the problem. They can use only 3 points to dot vote (no more than 2 points on a cause).
- In the end, address each cause (or top X). Brainstorm for solutions, within the big group or in smaller teams. For this, use a separate board/activity.
Debrief (suggested)
- The facilitator may ask the following questions:
- Before completing the diagram, what were the teams’ assumptions concerning the root cause for the stated problem?
- How did assumptions change after completing the diagram?
- How did teams identify the root cause(s) on which to focus?
Variations
Use the Fishbone diagram to address different problems:
- why are the projects delayed in our organization;
- why are we constantly missing our deadlines;
- why didn’t we meet the sales targets;
- why NPS drop, et cetera
Additional info
This activity follows activity type guide from CARTA
Play in Colltrain
Choose your language